How to do a simple linear regression in Excel
See how easy it is to do a simple linear regression in Excel and analyze if the results obtained are consistent!


I'm sure in the sentence "simple linear regression in excel", the second and third words can scare, and the most reassuring part is the simple word, is not it?
This word both indicates that we are going to make linear regression easier to get, as you can also be sure that it expresses how easy it will be to do all of this in Excel!
So read on to learn how to do a simple linear regression in Excel, as well as evaluate if you got a good result, and what that means. Let's go?
Collecting Data
The first step in a regression is data collection. In the case of simple linear regression, we will have only two variables:
- X Variable: independent variable.
- Y Variable: dependent variable.
Firstly, we will work with a simple example. A survey was made considering the average family consumption of several United States families, based on increasing income values, that is, with X dollars, how many Y dollars they consumed.
Are you tired of missing out on incredible career opportunities because you don't know about the main Excel tools?
So you are in the right place! In the Excel for Beginners course, you will learn to work with data in an agile way.
In addition, the course is available for FREE, just click on the banner button below and embark on this journey of knowledge!

Enabling Data Analysis
After collecting and organizing the data, it is necessary to prepare the data analysis. There are two ways to do this. One by scatter plot and one more complete, by using the Excel data analysis module.
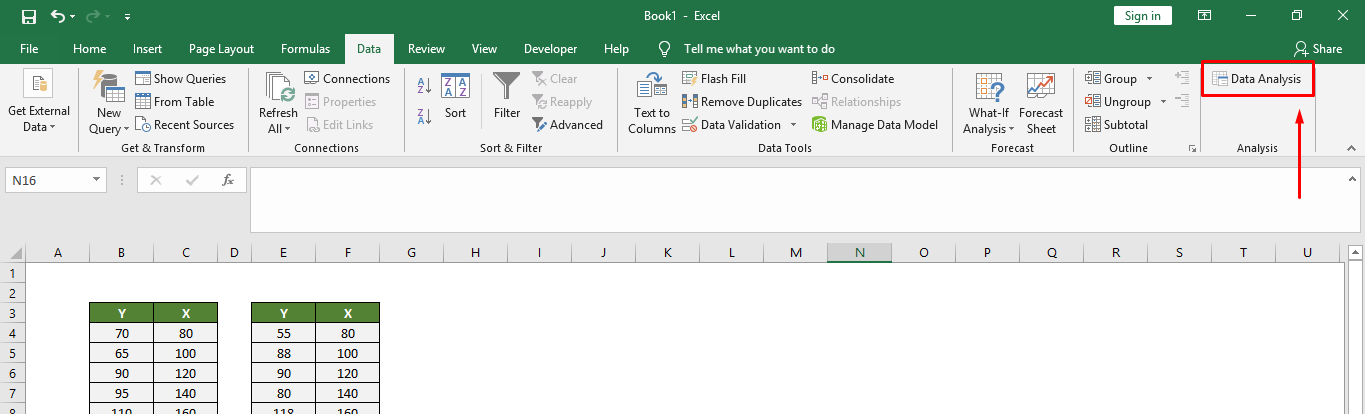
We will use Data Analysis, so it is necessary to find out if this option is already enabled in your software. To do this, just click on the Data tab, and see if the desired option appears in the upper right corner, as shown in the image:
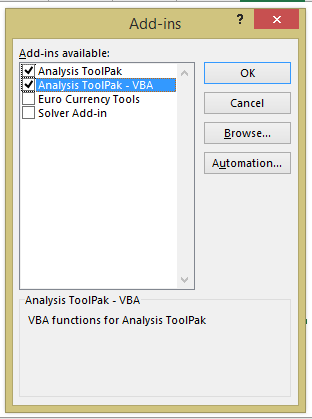
If this option is not enabled, simply click File > Options > Add-ins > Go ... and then you you must select the 2 options marked on the image:
This way, the Data Analysis option will appear and you are ready to go!
Preparing the data analysis
To begin the analysis, simply click on data analysis and the following window will appear:
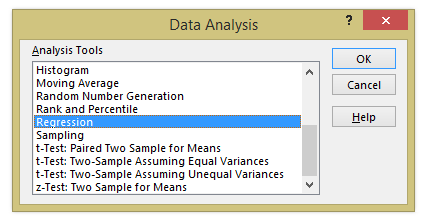
Just select Regression as shown in the image, and another window will open.
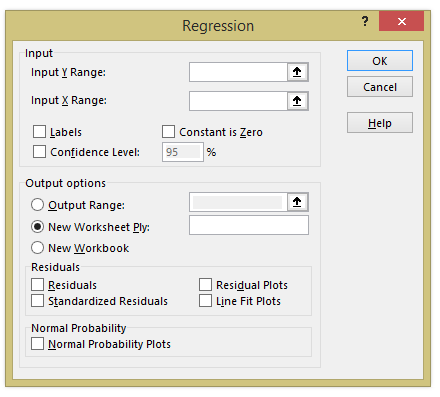
To continue, simply place the cursor as in the image above and select the range of Y and the range of X you want to analyze. First we will analyze the table on the left, that is, you must select for Y and for X the following intervals:
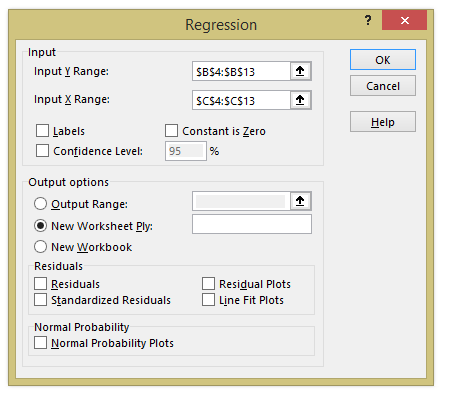
Before you click Ok and get your linear regression in excel, you should select the confidence level for 95% because a 5% error is a good estimate in statistics.
You can allocate your analysis data either in a new worksheet, as selected in the image above, or in the same worksheet. For our example, we will keep the new worksheet option selected.
Also select the option of residuals, residuals plot, standardized residuals, and line fit plots as they will help us in our analyzes. The window will look like the image below:
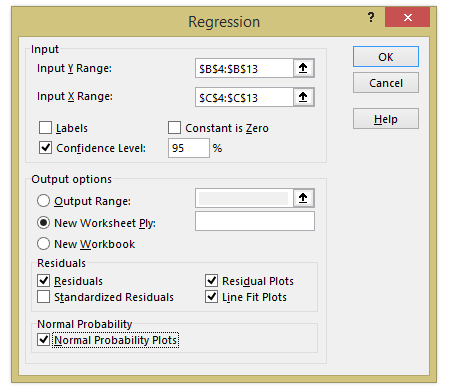
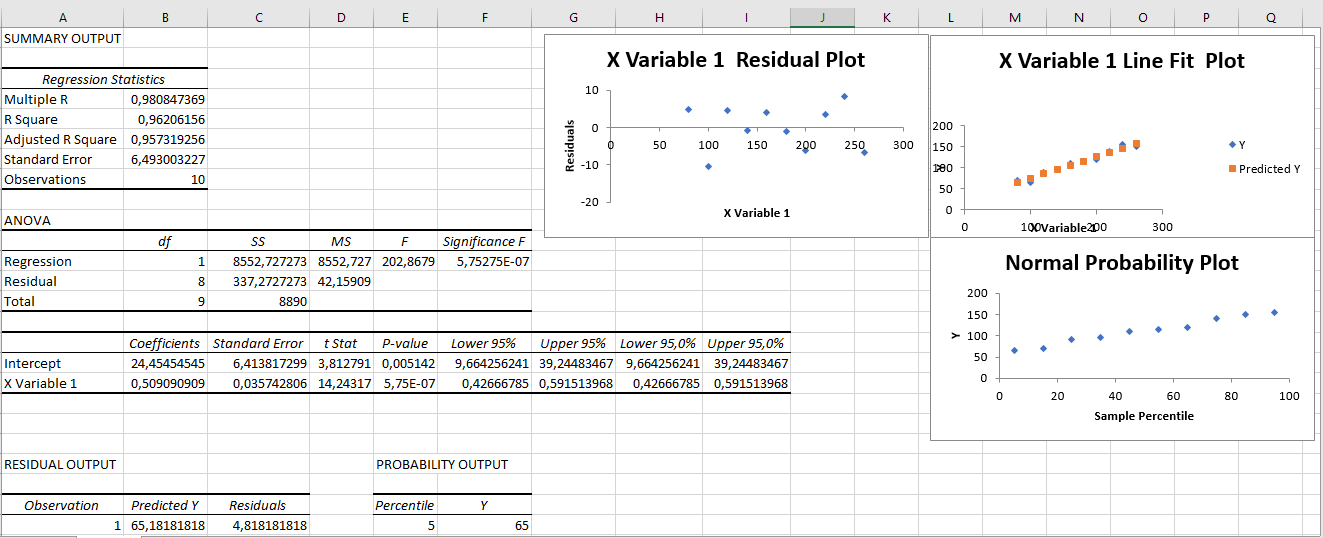
When you click Ok, you will see the following data in your new worksheet:
How do you know if this linear regression makes sense?
It is not enough to just do simple linear regression in excel, we have to evaluate to see if this regression makes sense. After all, some questions come up and need to be answered, such as:
- Is the equation really adequate for the kind of correlation between the two variables?
- Will the model be useful for predictions?
Thus, in order to answer these questions and conclude that the linear regression model is adequate, we must evaluate three points:
- P-value of the regression: it defines if there is a correlation between the variables
- Residuals analysis: defines whether the equation is actually adequate
- Coefficient of determination (R²): defines the representativity of the variable x to explain the behavior of the variable y.
Analyzing these 3 points of simple linear regression we can see if the model is suitable for such study. So let's begin?
P-value of the regression
The decision rule is as follows:
- p-value < 0.05 - the correlation between the two variables is significant.
- p-value > 0.05 - correlation between the two variables is not significant
For our example we can see that the p-value is 0.005142172, ie, the correlation between two variables is significant:

Residuals Analysis
The simplest analysis to do in this step is to check whether the predicted Y and the real Y are too far away or not. This difference between the real and the predicted is just the residue, and if it increases as the X values ??increase, it means that something is wrong.
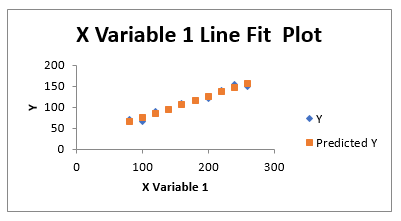
As you can see, the residuals do not increase with the growth of X, so we can move on to the next step.
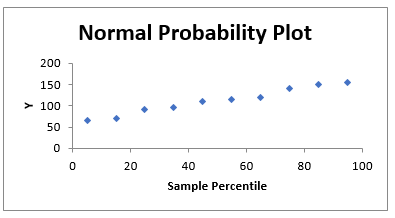
Another graph that we can analyze is the probability plot, which is used to evaluate if the distribution of the residuals is a normal curve or if it is necessary to transform the variables. As our probability graph is close to a straight line, we can conclude that the distribution of the residuals is normal.
Coefficient of determination (R²)
In this step we have the following decision rule:
- The coefficient will be calculated as 0
- The closer to 100%, the greater the representativeness of the variable x when explaining the behavior of the variability that occurs with the variable y, being ideal one above 50%.
In our example, we have the following value for the determination coefficient:
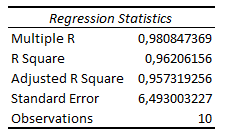
Transforming for percentage, we have that the variable X has 96.21% of impact on variable Y, which is an excellent influence.
Did you understand the analysis process?
As important as doing simple linear regression in Excel is whether the result obtained is consistent. After all, if there is no correlation between the variables, it does not make sense to use this statistical tool.
In the example that we made all the criteria were met, therefore, it is possible to use simple linear regression to study the process itself. However, linear regression is not always a good model, and it becomes necessary to use more complex tools!
If you made it this far, I have a question for you...
Today one of the most demanded skills in selection processes is the use of Excel. And to give you a good idea of the first steps and first functions, we created the Excel eBook for Beginners.
By downloading our eBook, you will have a step-by-step and practical guide to be able to create your first spreadsheets, and use your most basic and essential functions.
Download it now!
![[EBOOK] Excel for Beginners](https://files.voitto.com.br/blog/prismic/4452920d-9accc706-d6a9-4044-b376-d932d55e820e_Bot_o_Banner_Cursos_-_TLSS_15_.png "[EBOOK] Excel for Beginners")