See how to use Weibull Analysis in your company and understand its functionalities
Weibull Analysis is one of the most used methods in reliability engineering. In this article, we'll understand its concept and how it works.


Weibull analysis is one of the main methods of determining characteristics over the lifetime of a product, that is, how long the product will function without defects. But why is this important?
According to the survey, Portraits of the Brazilian Society on Consumer Practices, carried out by the National Confederation of Industry (CNI), 74% of people consider the warranty period of a product before making a purchase.
Therefore, we will show you how the Weibull analysis can add value to a product through its reliability assessment methods, through the following items:
- What is Weibull Analysis?
- Weibull analysis data types;
- How Weibull Analysis Works;
- Why run Weibull analytics on your business?
Let's go!
What is Weibull Analysis?
Weibull analysis was created in 1937 by Swedish engineer and mathematician Ernst Hjalmar Waloddi Weibull. He became known in the field of probability and statistics for his formulation of the Weibull distribution, a probabilistic method that determines the average lifetime and failure rate over time.
Weibull wrote an article on the subject in 1951, but it was initially unsuccessful. His model was viewed with distrust and rejection. However, it began to be perfected, until it was implemented by the US Air Force in the 70s. Later, it was also used by the automotive industry.
Weibull analysis is used in many areas such as Chemistry, Biology, Physics, and Mathematics. With this method, scientists can determine the incidence rate of lung cancer in smokers or the magnitude of earthquakes, for example.
However, one of its most important applications is its use in industry. Weibull analysis is very important for reliability engineering, and today it is the main method for estimating the lifetime of a product.
These predictions are made based on a statistic generated from the live data of a representative quantity of units of a given product. Life data is measured over the life of a product. These measurements can be in minutes, hours, kilometers, cycles, etc...
As you can see, the concepts of Weibull analysis are directly related to quality and failure reduction within the industry. This same thinking is directly related to Lean Manufacturing.
Do you want to be able to reduce waste within a company?
Want to know how to jumpstart your career and become a true leader?
Discover the Leadership Development Program for FREE, which prepares you to be a complete leader through personal development, communication techniques, feedback practices and coaching concepts to help you achieve high performance.
Do you know the importance of self-knowledge in shaping a true leader? Knowing your options and weaknesses is fundamental for you to be ahead of a team and be prepared for the most adverse situations.

Weibull Analysis Data Types
We have different types of life dice and each of them tells us different characteristics of an item's lifespan. They also define the method of analysis, which varies with each one. Are they:
Complete data
The complete data tells us exactly the time to failure, that is, the measure of the time in which the product worked without having defects until the moment in which a defect occurred.
For example, a certain item of a product failed with 200 hours of operation.
Data censored on the right
The data censored on the right are obtained from a test with a predetermined period. For example: to test a washing machine, the reliability analyst establishes that 5000 wash cycles must be successfully executed.
Therefore, the product must operate satisfactorily up to the known time and may or may not continue to function, within acceptable quality criteria for an indefinite period (the machine runs 5500 cycles until failure, for example).
Interval data
Interval data does not report an exact time to failure like full data. What we get from them is knowing that the failure will occur within a defined period between two test points.
For example, a microwave oven model failed its components between 300 and 400 hours of use, after testing different units.
Left Censored Data
Left-censored data is similar to interval data in that it also represents failures within a period but not an exact time.
The difference is that this type occurs from the starting point of testing. This means that the product will fail sometime between 0 and some amount of testing hours. For example, an electric oven will malfunction between 0 and 100 hours of use.
How Weibull Analysis Works
Now, let's check out the 4 steps to perform a Weibull analysis:
1º. Testing and identification of data
The first step is to carry out the laboratory tests that will allow us to access the data. Once done, we now need to identify the types of data we will work with, as we said in the previous topic. This definition will influence the entire process.
2º. Choose an appropriate lifetime distribution
A statistical distribution is nothing more than a curved graph. The area below this curve represents the probability that an event will occur. In the case of the Weibull analysis, this area indicates the hypothesis of a failure occurring in that period. That is, we call it a reliability function.
Let's see an example chart:
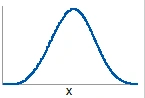
Think of the horizontal axis as elapsed time, and the vertical as the density of faults. The point X, the highest in the function, is where we have a higher probability of a failure occurring. That's why we call this type of graph the Probability Density Function.
There are several types of charts within the Weibull analysis, which vary depending on the data collected. Usually, specific software already makes the choice automatically.
3º. Determine confidence parameters
Now, we determine parameters to assess the reliability of the tested item. We can use, for example, the MTBF (Mean Time Before Failure) - Mean Time Before Failure - or known as useful life, which determines the period that the product must operate without defects.
4º.Create trust charts
The last step is to create graphics about the characteristics discovered through the letters, to make the process more visual.
Why perform a Weibull analysis on your company?
Most companies today adopt warranty policies and monitor the failure rate of their products using Weibull analysis. They do this to reduce warranty costs and avoid loss of reputation and brand value, thereby managing risk.
In addition, the information provided by this analysis allows for more accurate planning of warranty terms and forecasting their costs. Weibull analysis is the most used method because it is very effective in determining the reliability characteristics of a product.
It is a very important tool for reliability engineers because it allows you to generate accurate statistics about a product using a relatively small amount of testing and in an easy way.
We can use the determination of various reliability characteristics of a product such as overall failure rates, a probability of failure by usage time, and its average lifetime.
Do you want to know more tools to improve the quality of your company?
Leverage results with ebook the 7 Quality Tools!
With this eBook, you'll learn how to use tools that will help you improve quality in any company:
• Flowchart
• Control Letters
• Ishikawa diagram
• Check Sheet
• Histogram
• Scatter Graph
• Pareto's chart
In it, you will also find definitions of the concept of Quality in the view of today's gurus. Plus a surprise that we prepared for you. A kit with DMAIC tools, to help you even more at the time of application. Do not miss this opportunity and download this material right now.